FlowWright Analytics
Business Intelligence That Really Helps.
When you use FlowWright to automate your business, you gain access to standard metrics and metrics that you define. Do you want to know:
- The status of your processes?
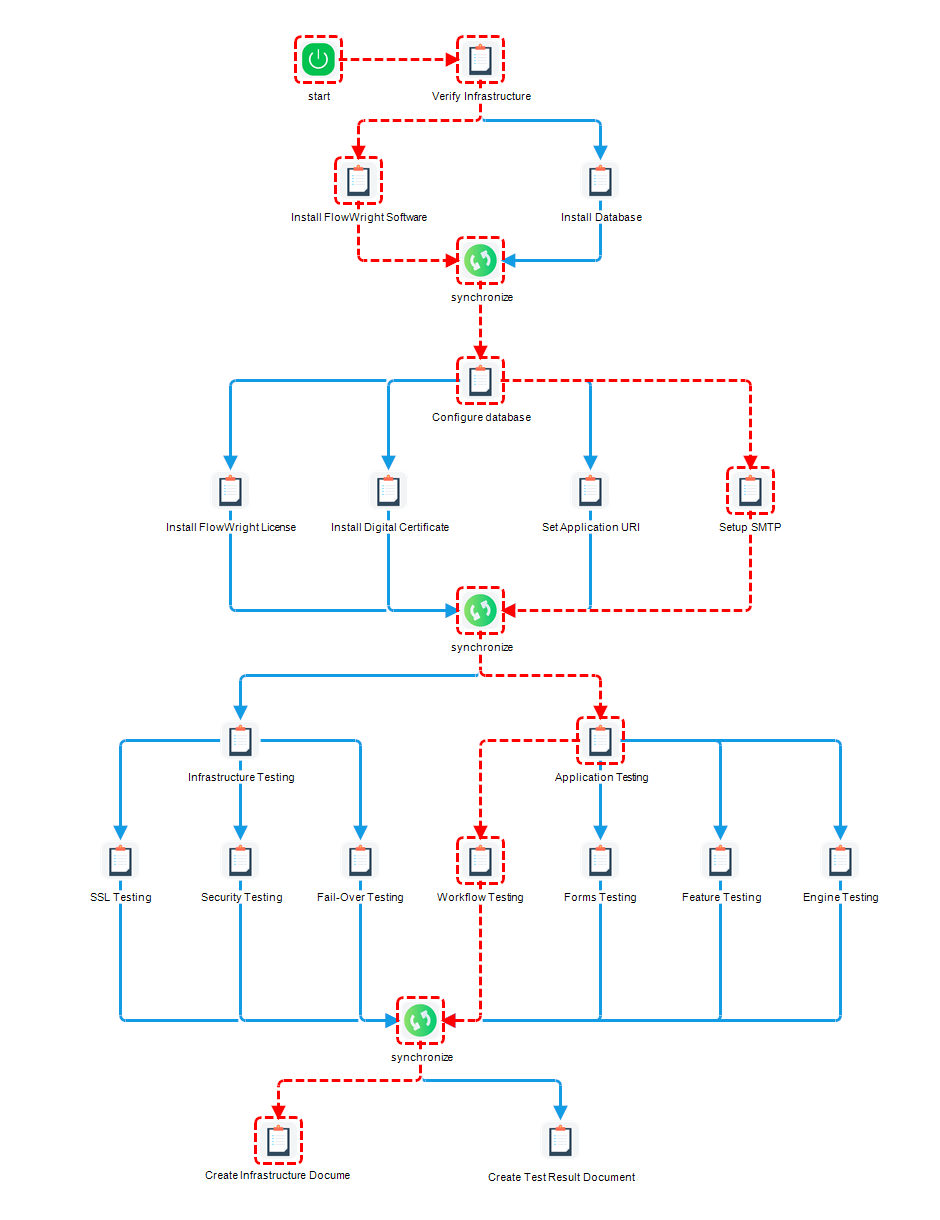
- How long critical parts of your processes take to execute?
- Where your bottlenecks are?
- What pathways are more efficient than other pathways?

Business Intelligence - Uncovering Opportunities
Organizations use iBPMS and enterprise workflow software to automate and integrate their business processes. These automated and integrated processes result in massive increases in efficiency, effectiveness, repeatability and quality. At the same time, the process of integrating and automating is a critical part of continuous improvement and digital transformation. What this means is that initial efforts to integrate and automate deliver initial stepwise improvements - then, organizations work to understand where existing or growing bottlenecks may exist or what steps in a process take the most time, or what the frequency of various workflow paths may be.
Organizations and business analysts work diligently to identify ways to improve processes, and Business Intelligence tools are critical to uncovering these opportunities. Business Intelligence tools are used to answer questions like, “Where is this process taking more time than we expected?” or, “What user takes the most time to approve a request?” or “What workflow path takes the most time?”

The answers to the questions posed to Business Intelligence tools reveal those areas that deserve a business analyst’s attention. By digging into the highlighted areas that are ripe for improvement, business analysts are able to sift through data and surface the specific causes for shortfalls in anticipated gains in efficiency, quality, throughput, effectiveness, etc.
Real-time Dashboards and Reports
When you use
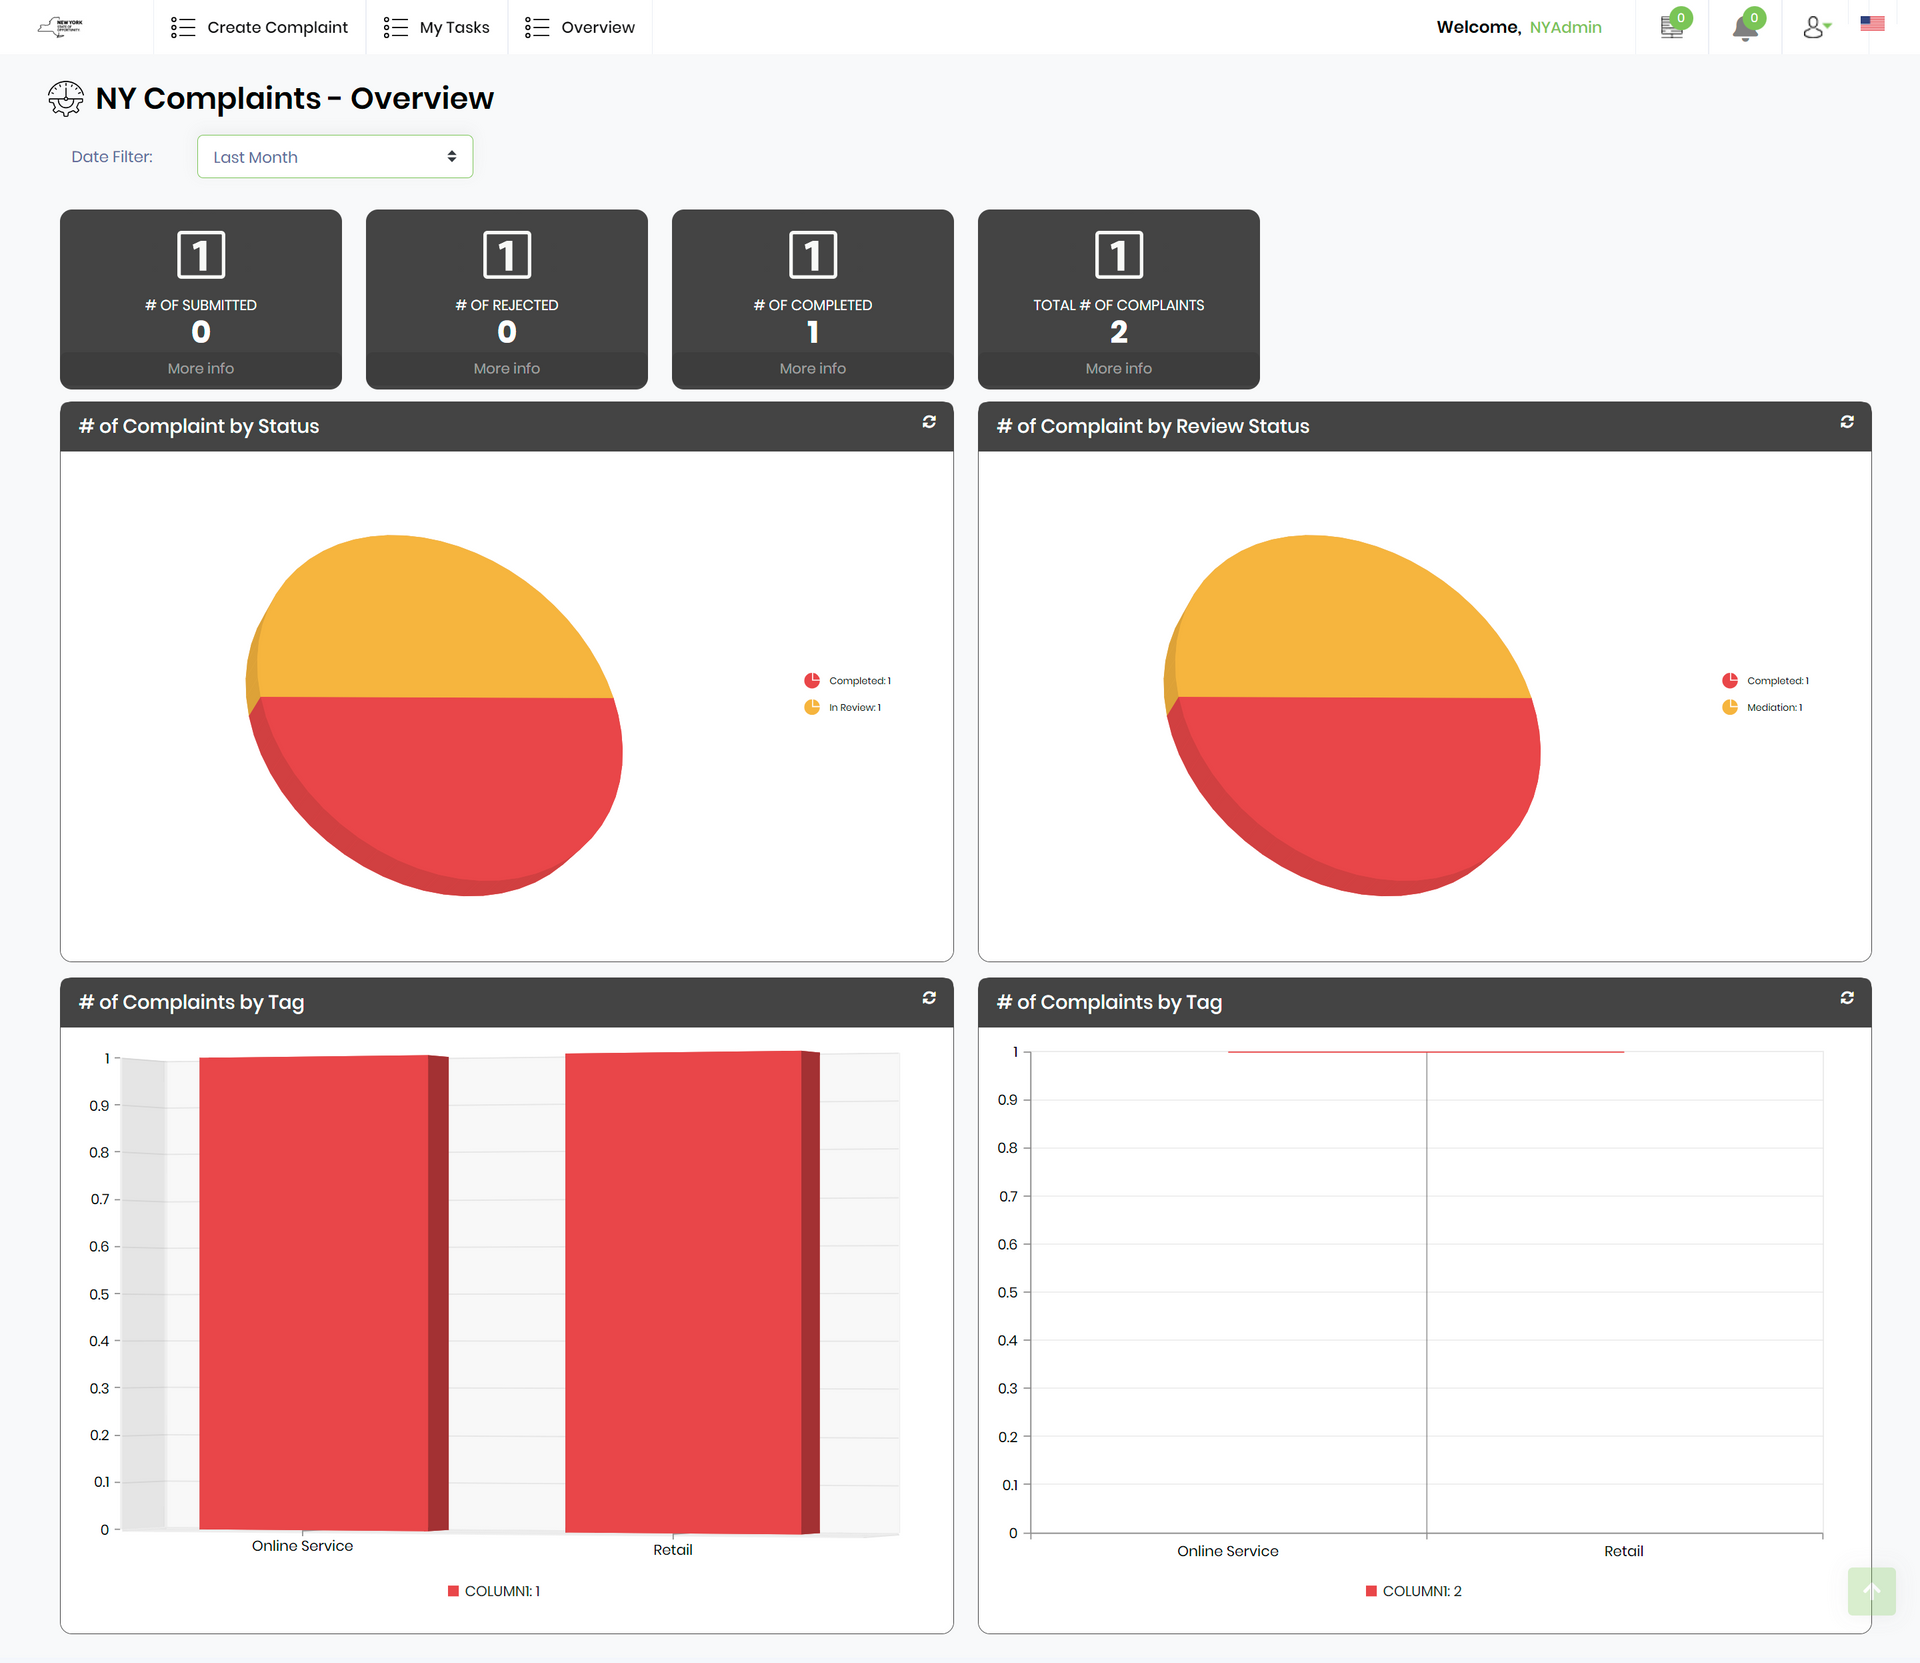
FlowWright iBPMS to automate and integrate your organization, you gain access to not only business intelligence but the ability to see real time dashboards and reports that are easily customizable to your needs. FlowWright includes an intuitive reports designer which leverages the data generated through integration and automation with our platform. Easily build intuitive dashboards that from a library of widgets which can be associated with the metrics that various roles in your organization need to manage risk, understand status and progress, and make decisions when those decisions can still make a difference!
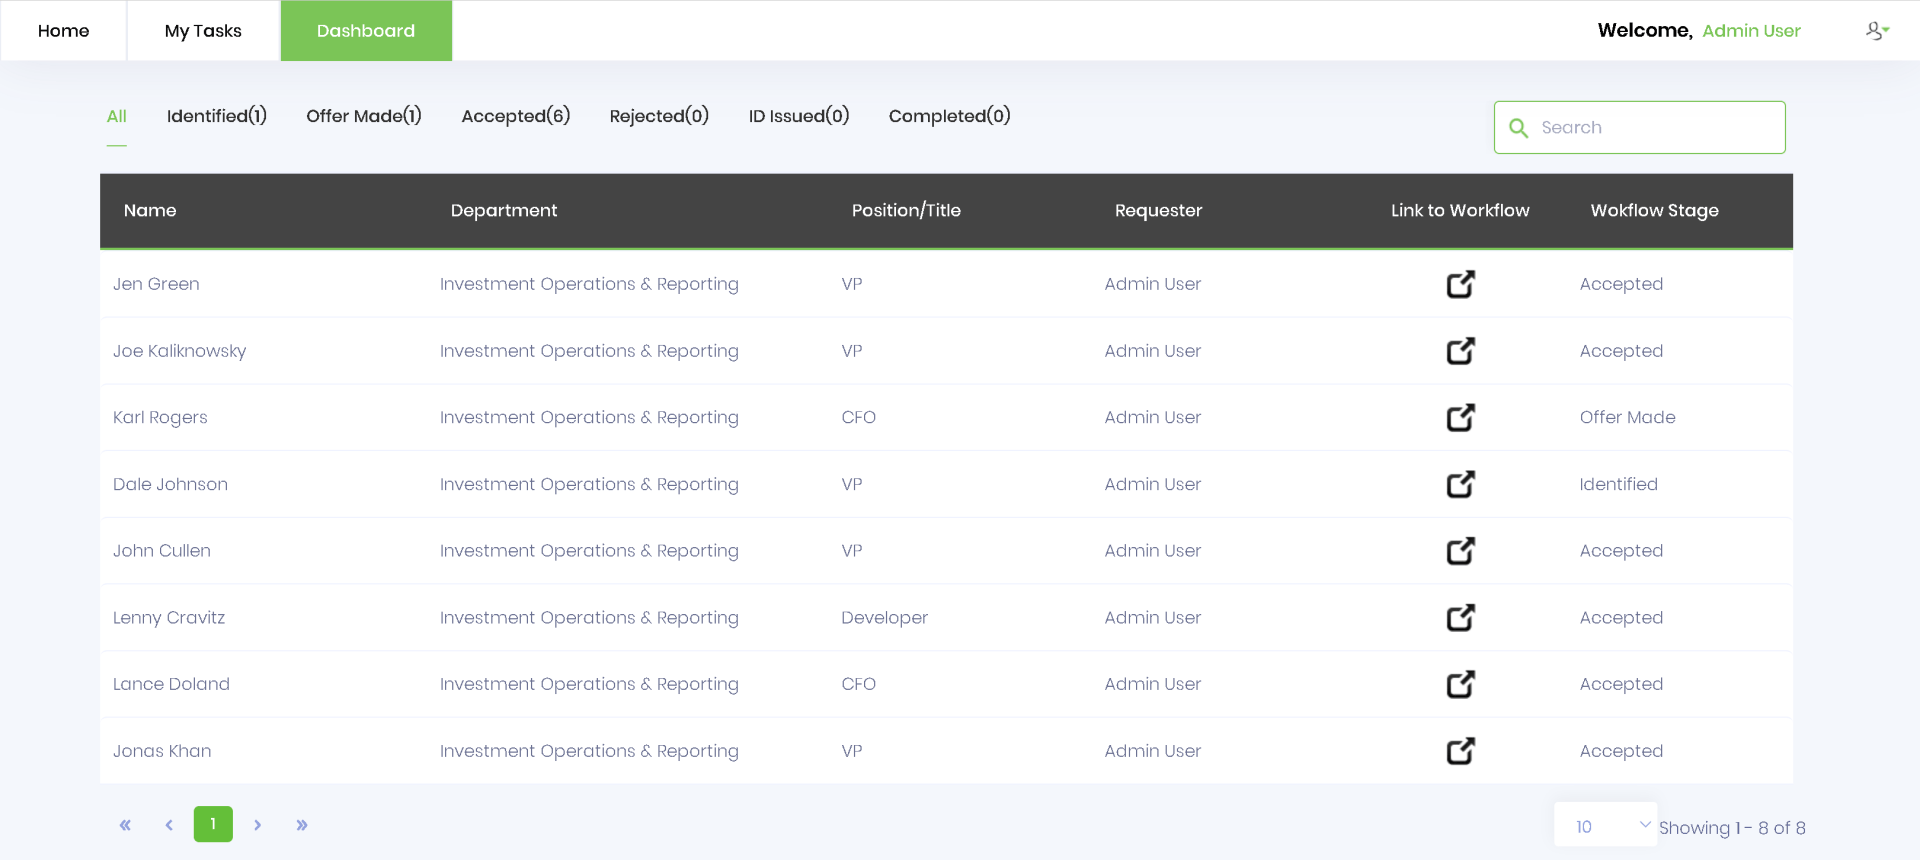
Get status and progress in real-time, here's an example from an Human resources employee onboarding application:


